Print this Page
The Black Stats & Facts
[su_spoiler title=”ABOUT THE BLACK STATS & FACTS” style=”fancy” icon=”plus-square-1″] [su_tabs][su_tabs vertical=”yes”][su_tab title=”WHAT”]What is/are the Black Stats & Facts?:
The Black Stats and facts are a collection of statistical data, as well as important information specific to the P.R.O.A.D, experience in Britain both in the ancient and in our modern times. [/su_tab] [su_tab title=” STATS”]The Stats:
This statistical data has been collected and collated from a variety of government departments and sources, through published data sheets, available through various U.K Government websites. These data sheets offer an insight into the current demographics, social impact and influences, in addition to the changing, not to mention challenging circumstance P.R.O.A.D, experience here in Britain at present.
These stats are offered as a tool to assist people in first understanding exactly want this experience represents throughout the U.K. and secondly to enable them to begin to strategically plan and develop strategies to try tackle any disparities, concerns or issues, where identified. These statistics will also be updated and added to as time progresses and as data becomes available to us. [/su_tab] [su_tab title=”FACTS”]The Facts:
The Facts, represents the evidence and data relating to the various social areas that these statistics, detail. From this statistical information many different facts can be drawn concerning the specific experience of P.R.O.A.D in Britain. These facts are therefore offered as a means of clearly identifying information that helps to give a better understanding of what is actually happening or the experiences of P.R.O.A.D in Britain, in addition to offering interested people the opportunity to better analyse the current situation and possibly identify root causes or come to conclusions as to why a particular statistic is either beneficially or detrimental to the general welfare and progress of P.R.O.A.D in Britain.[/su_tab] [su_tab title=”PURPOSE”]The Purpose:
It is imperative that people who have a genuine interest in the affairs and circumstances of P.R.O.A.D. in Britain their experience and presence, have access and be aware of the available evidence and facts specific to these people. Without this information people often fall victim to their own or other people’s assumptions that inevitably results in poor effectiveness or even ineffectiveness, when trying to address, some the issues affecting P.R.O.A.D. in Britain. It is important therefore that all service providers, groups and organizations, as well as businesses are fully aware of these statistics and facts in order for them to better target their support to tackle many of the social issues affect P.R.O.A.D. in Britain.[/su_tab][su_tab title=”NEED”]The Need:
Althoughit is essential that people, i.e. service providers, groups, organizations a entrepreneurs are aware and have access to statistical data, to better plan, target, market and develop their services and provisions,notwithstanding the fact this data is freely available to all. Nevertheless this data specific to P.R.O.A.D. in Britain is not that easily accessed, as it is normally found with whole population statistics, of which they make up a very small proportion (4.5%). Thereforein order toensure that this data is more easily accessible to all, the R.O.O.T.S Campaignthrough The African British Connection have collated some of this data in a central location, i.e. Imani’s Website, saving people the time of scouring the many available data sheets, to acquire this information.[/su_tab][/su_tabs][/su_spoiler][su_spoiler title=”U.K. POPULATION BLACK STATS” style=”fancy” icon=”plus-square-1″][su_tabs vertical=”no”][su_tab title=”ALL THE U.K. POPULATION”]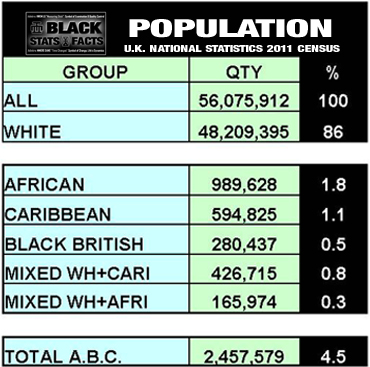 KEY POINT: P.R.O.A.D. Make p 4.4% to 4.5% of the U.K population of 56,075,912, this represents a number of approximately 2,457, 579, P.R.O.A.D. based upon the latest national statistics i.e. 2011 Census. Incorporated within this 4.5% is the African, African-Caribbean, Black, Mixed population within Britain. The largest community of the P.R.O.A.D in Britain are the African’s, direct from the continent, who makeup 1.8% of this 4.5% total P.R.O.A.D population.[/su_tab][su_tab title=”MALES”]
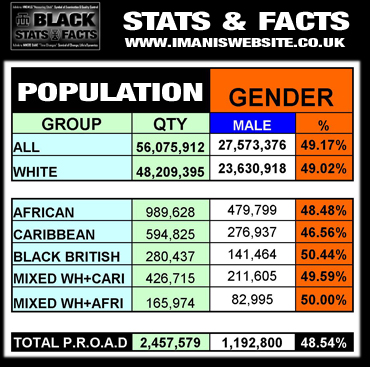 KEY POINT: There are less males than females within the larger ethnic groups. What could be the reason for this? [/su_tab][su_tab title=”FEMALES”]
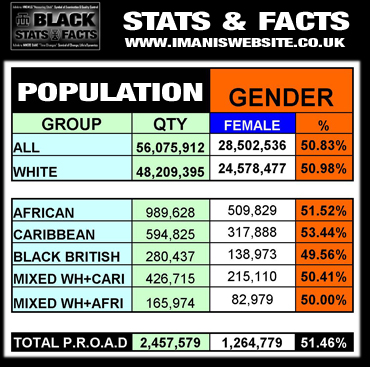 KEY POINT: Females outnumber the males in all groups except the Black British. What could be the reason for this? [/su_tab][su_tab title=”0-15″]
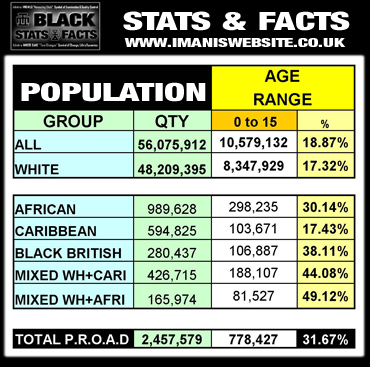 KEY POINT: The 0-15 year old’s make up the largest proportion of all P.R.O.A.D in Britain. All groups except the Caribbean have much higher proportions of this age range than the Whites. Caribbeans have a very similar proportion to the general populace. What could be the reasons for this? [/su_tab] [su_tab title=”16-24″]
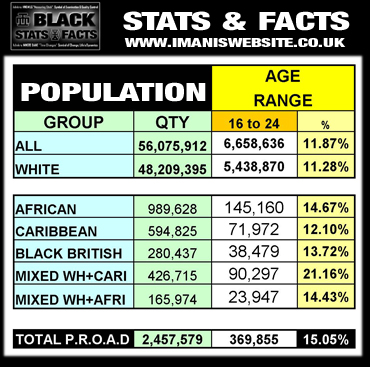 KEY POINT: Although all P.R.O.A.D have a higher proportion of 16-24 year old’s than the general populace, Mixed White & Caribbean nearly double that of Whites and is also much higher proportionally than all other P.R.O.A.D groups. What could be the reason for this? [/su_tab] [su_tab title=”25-34″]
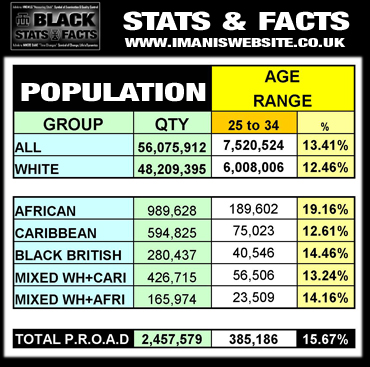 KEY POINT: Africans from the continent have a higher proportion of 25-34 year old’s than all other P.R.O.A.D and the general populace. What could be the reason for this? [/su_tab] [su_tab title=”35-49″]
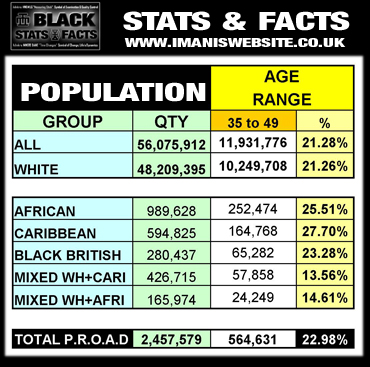 KEY POINT: 35 – 49 year old’s represent the largest proportion of the general population and the second largest proportion of aged people within all P.R.O.A.D, except the Mixed. What could be the reason for this? [/su_tab] [su_tab title=”50-64″]
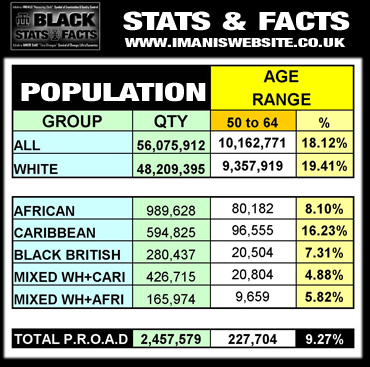 KEY POINT: Only the Caribbean groups have a proportion of 50-64 year old’s comparable to the general populace, all other P.R.O.A.D have a very small proportion of this age range. What could be the reason for this? [/su_tab] [su_tab title=”65+”]
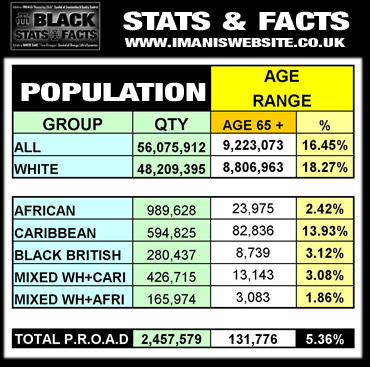 KEY POINT: Other than the Caribbean’s all other P.R.O.A.D have a very small proportion of people aged 65 and over. What could be the reason for this?[/su_tab] [/su_tabs][/su_spoiler][su_spoiler title=”U.K. QUALIFICATIONS BLACK STATS” style=”fancy” icon=”plus-square-1″][su_tabs vertical=”no”][su_tab title=”ALL”]
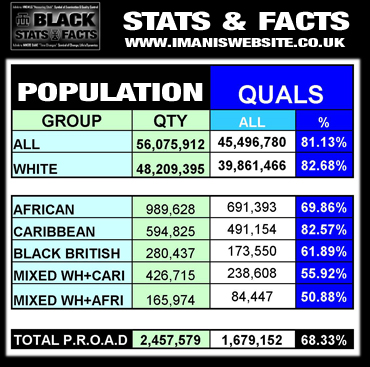 KEY POINT: Of all the P.R.O.A.D only the Caribbean have a proportion of people aged 16+ with qualifications, comparable with that of the general populace. Other P.R.O.A.D have a much lower proportion of people with qualifications than the general populace, particularly the Mixed groups. What could be the reason for this?[/su_tab][su_tab title=”NO”]
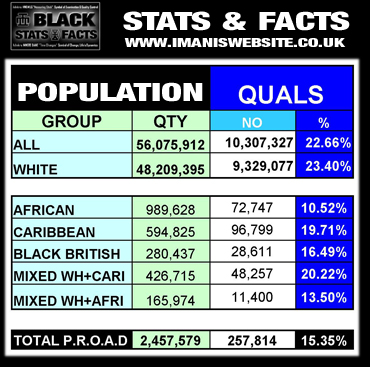 KEY POINT: Both the African’s from the continent and people Mixed with these African’s have less people proportionally with no qualifications than the general populace and other P.R.O.A.D. What could be the reason for this?[/su_tab][su_tab title=”L1″]
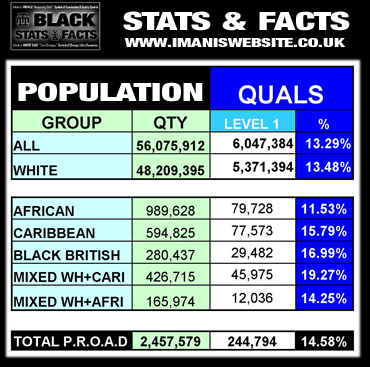 KEY POINT: Mixed White & Caribbean have a much higher proportion of people with level 1 qualifications from the general populace and other P.R.O.A.D. Although all Caribbean P.R.O.A.D, have a higher proportion than all other groups. What could be the reason for this?[/su_tab][su_tab title=”L2″]
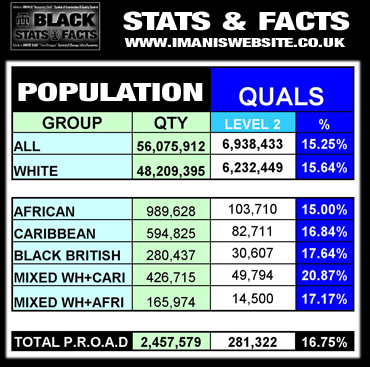 KEY POINT: As with Level 1 qualifications, people Mixed White & Caribbean have a much higher proportion of people with Level 2 Qualifications also. What could be the reason for this? [/su_tab][su_tab title=”A”]
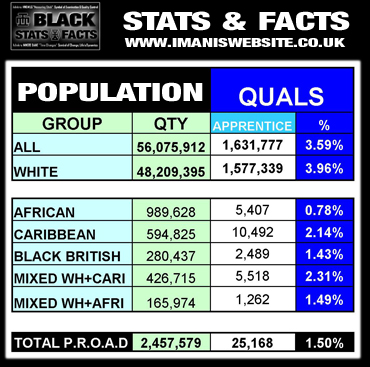 KEY POINT: All P.R.O.A.D have fewer people proportionally who have/are doing apprenticeships, however the Caribbean & Mixed Caribbean have more people than other P.R.O.A.D. What could be the reason for this?[/su_tab][su_tab title=”L3″]
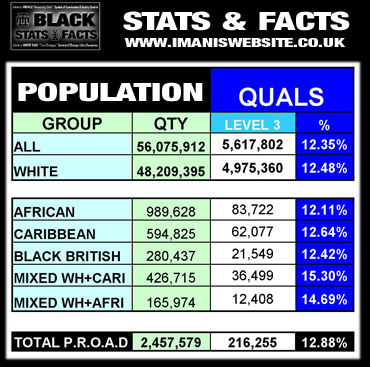 KEY POINT: At Level 3 the African, Caribbean & Black British have similar proportions of people qualified to the general populace, however the Mixed P.R.O.A.D, have a higher proportion. What could be the reason for this? [/su_tab][su_tab title=”L4″]
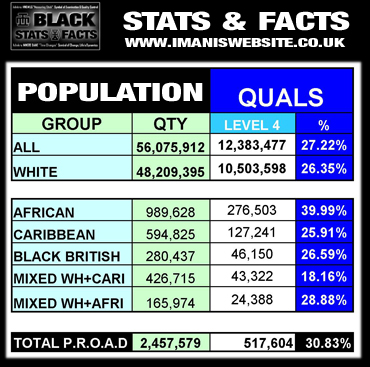 KEY POINT: Africans from the continent have a higher proportion of people qualified at Level 4 than the rest of P.R.O.A.D. including the general populace. However Mixed White & Caribbean have the least proportion of people qualified at this Level. What could be the reason for this? [/su_tab][su_tab title=”OT”]
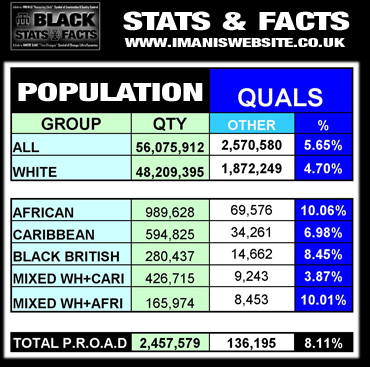 KEY POINT: Although this data does not indicate what other means, based upon previous heads, it is assumed that it represents higher qualifications than Level 4. This being the case both African’s from the continent & Whites mixed with these African’s have a much higher proportion of people qualified at this Level. Mixed Caribbean also have a very low proportion. What could be the reason for this? [/su_tab][/su_tabs][/su_spoiler]
[su_spoiler title=”U.K. RELIGION BLACK STATS” style=”fancy” icon=”plus-square-1″][su_tabs vertical=”no”][su_tab title=”CHRISTIAN”]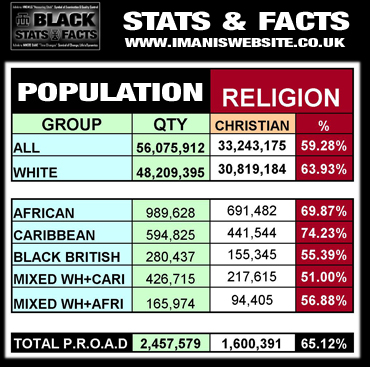 KEY POINT: Christians by far, make up the largest proportion of the general populace and all P.R.O.A.D in Britain. However natives to Africa & the Caribbean have a much higher proportion than the general populace and other P.R.O.A.D, in fact those classified as Black British and the Mixed groups, have a lower proportion of Christians than all the other featured groups. What could be the reason for this? [/su_tab][su_tab title=”MUSLIM”]
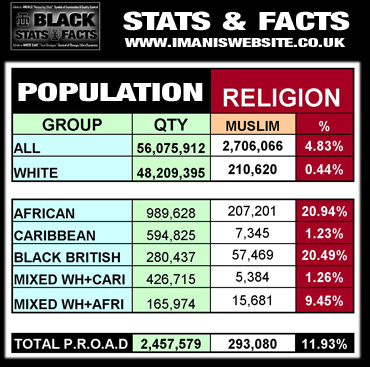 KEY POINT: Although Muslims make up a very small proportion of general populace, both African’s from the continent and Black British have significantly higher proportion of adherents. Caribbean people and people Mixed with Caribbeans have a very low proportion. What could be the reason for this? [/su_tab][su_tab title=”JEWISH”]
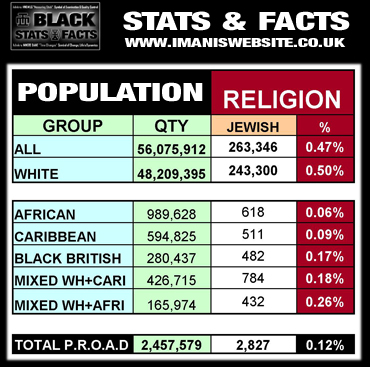 KEY POINT: There is a very low proportion of Jewish people in the general populace and amongst the P.R.O.A.D groups. Although the Jewish people make up 0.47% of the general populace. Jewish White people account for the vast majority of this number. What could be the reason for this?[/su_tab][su_tab title=”BUDDHIST”]
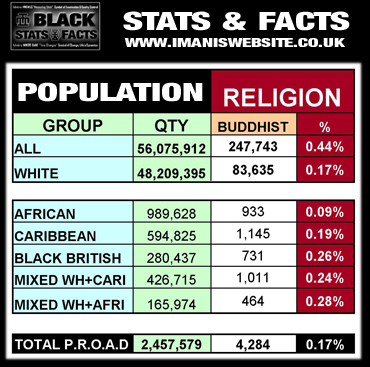 KEY POINT: All P.R.O.A.D have a slightly higher proportion of Buddhist adherents than Whites, except for the Africans from the continent. What could be the reason for this?[/su_tab][su_tab title=”HINDU”]
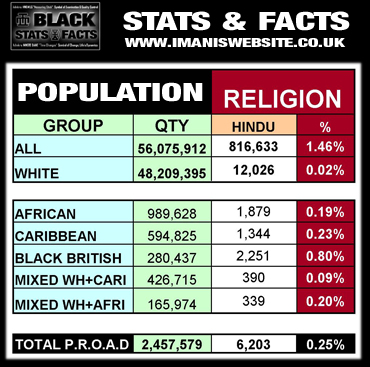 KEY POINT: Whites have the smallest proportion of Hindu adherents of all groups featured, whilst the Black British has the highest. What could be the reason for this? [/su_tab][su_tab title=”SIKH”]
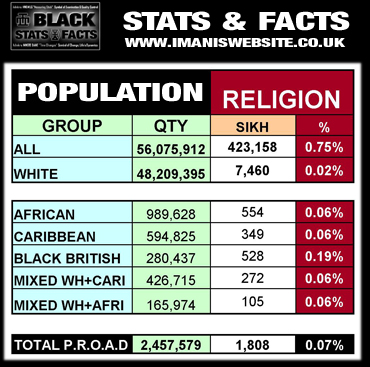 KEY POINT: Like with Hinduism, Whites have a very low proportion of Sikh adherents of all groups featured and again the Black Brritish has the highest. What could be the reason for this?[/su_tab][su_tab title=”OTHER”]
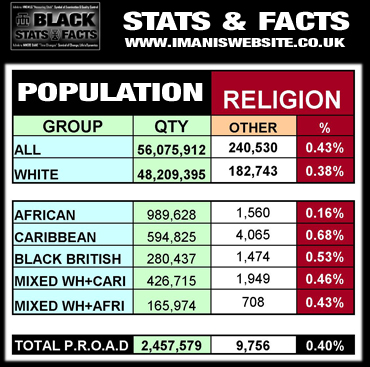 KEY POINT: All groups have a very small proportion of people that stated they belong to a different religion other than those sited within the census. Of these groups African’s from the continent have the lowest proportion, whilst the Caribbeans has the highest. What ould be the reason for this?[/su_tab][su_tab title=”NO”]
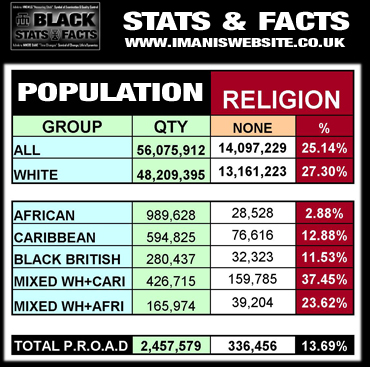 KEY POINT: Of all the groups featured the African from the continent have the least proportion by far of people with no religion, whilst the Mixed Caribbean has the highest. What could be the reason for this?[/su_tab][su_tab title=”NOT STATED”]
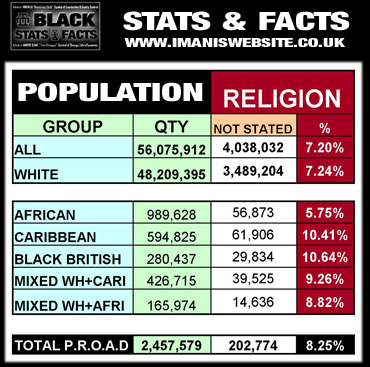 KEY POINT: African’s from the continent were the least likeliest to not state what their religion or faith was. Both the Caribbean’s & Black British have the highest proportion. What could be the reason for this?[/su_tab][/su_tabs][/su_spoiler]
[su_spoiler title=”U.K. CRIME BLACK FACTS” style=”fancy” icon=”plus-square-1″][su_tabs vertical=”no”][su_tab title=”STOPS”]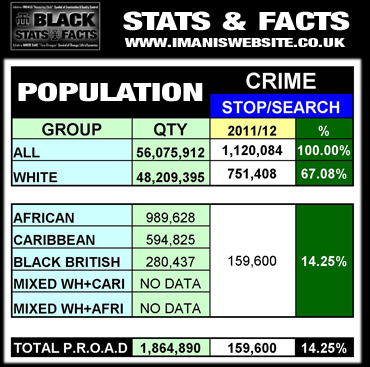 [/su_tab] [su_tab title=”ARRESTS”]
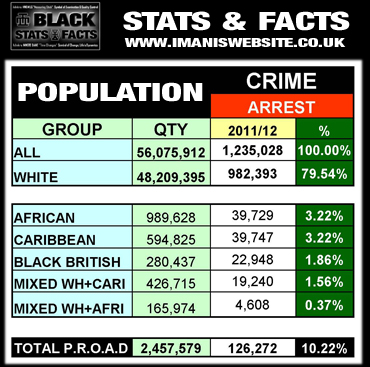 Content 2[/su_tab] [su_tab title=”PND’S”]
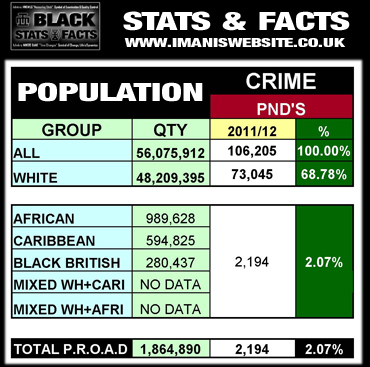 Content 3[/su_tab] [su_tab title=”CAUTION”]
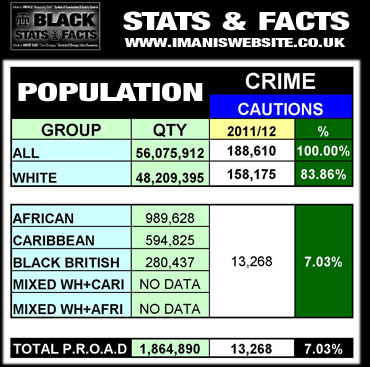 Content 4[/su_tab][su_tab title=”COURT”]
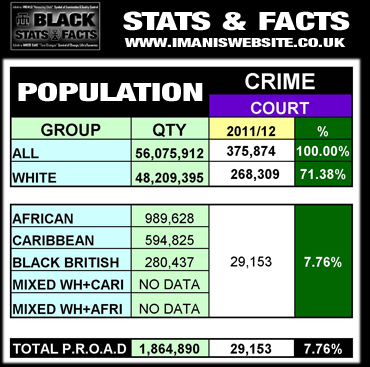 Content 7[/su_tab][su_tab title=”CONVICTION”]
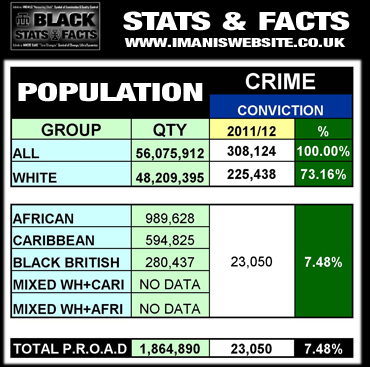 Content 6[/su_tab] [su_tab title=”JAILED”]
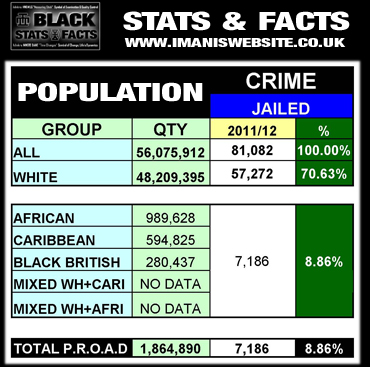 Content 7[/su_tab] [su_tab title=”PRISONERS”]
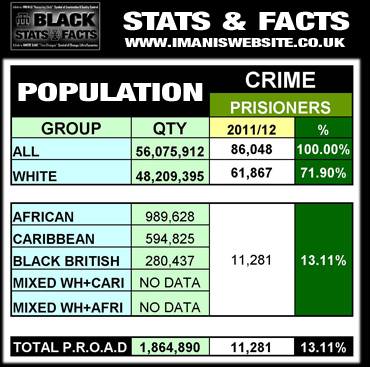 Content 5[/su_tab][/su_tabs][/su_spoiler]
[su_spoiler title=”U.K. P.R.O.A.D BREAKDOWN BY COUNTRY & CITY ” style=”fancy” icon=”plus-square-1″][su_tabs vertical=”no”][su_tab title=”U.K”]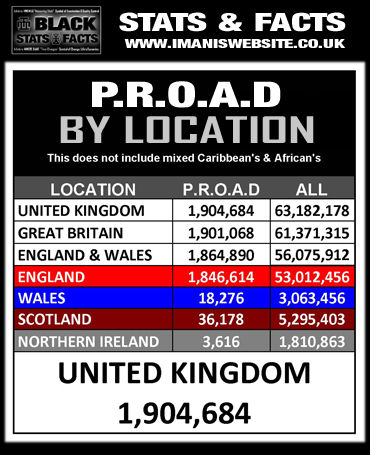 [/su_tab] [su_tab title=”N.E”]
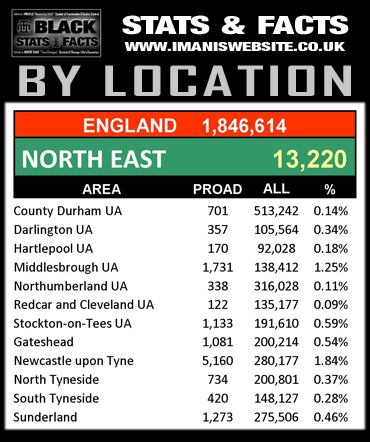 [/su_tab] [su_tab title=”N.W”]
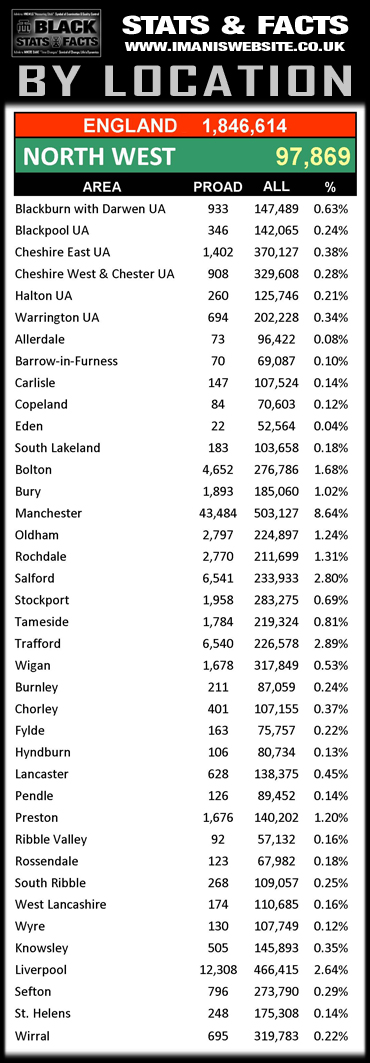 [/su_tab] [su_tab title=”YRK”]
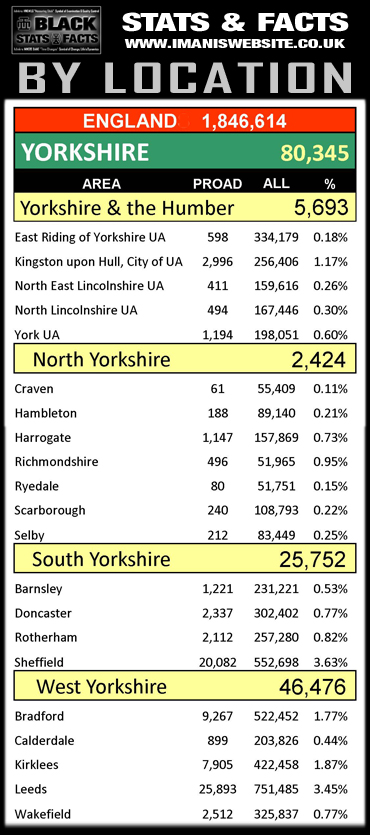 [/su_tab][su_tab title=”E. MIDS”]
 [/su_tab][su_tab title=”W.MIDS”]
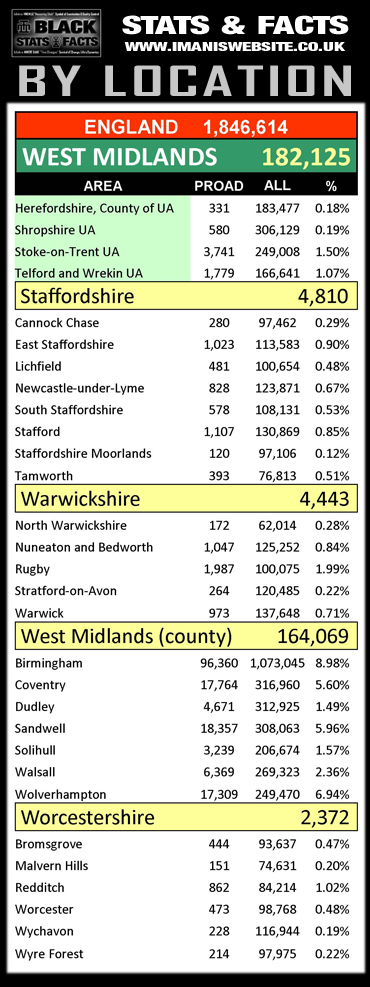 [/su_tab] [su_tab title=”E”]
 [/su_tab] [su_tab title=”LONDON”]
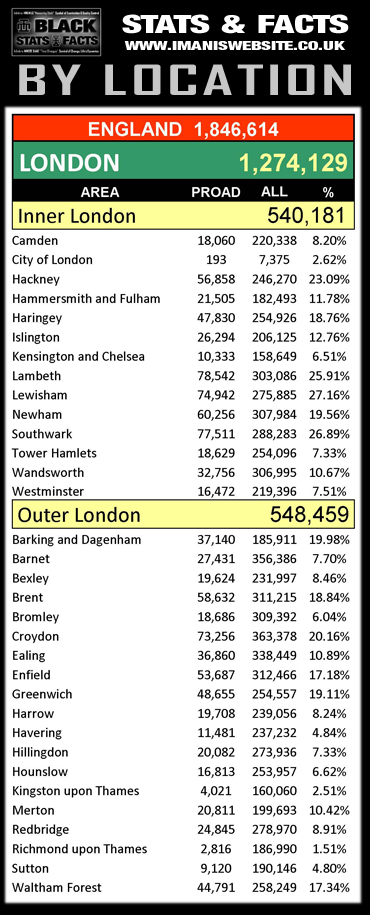 [/su_tab][su_tab title=”LON2″]
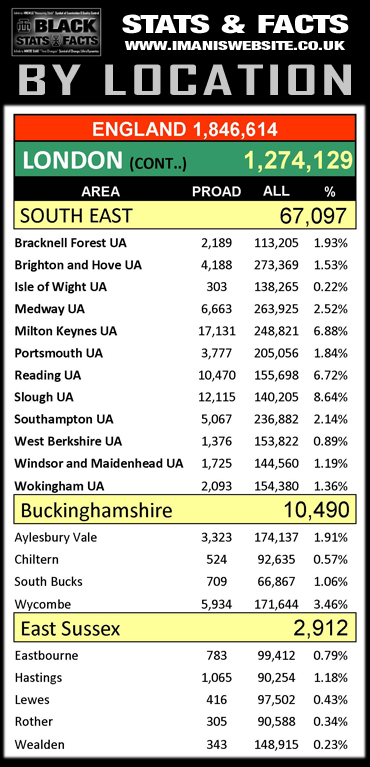 [/su_tab] [su_tab title=”LON3″]
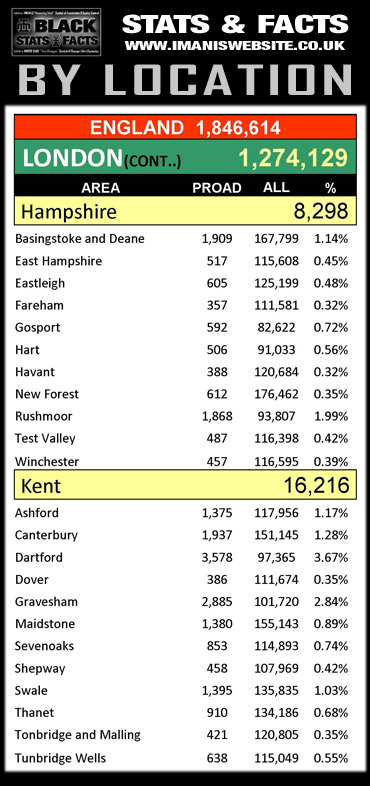 [/su_tab] [su_tab title=”LON4″]
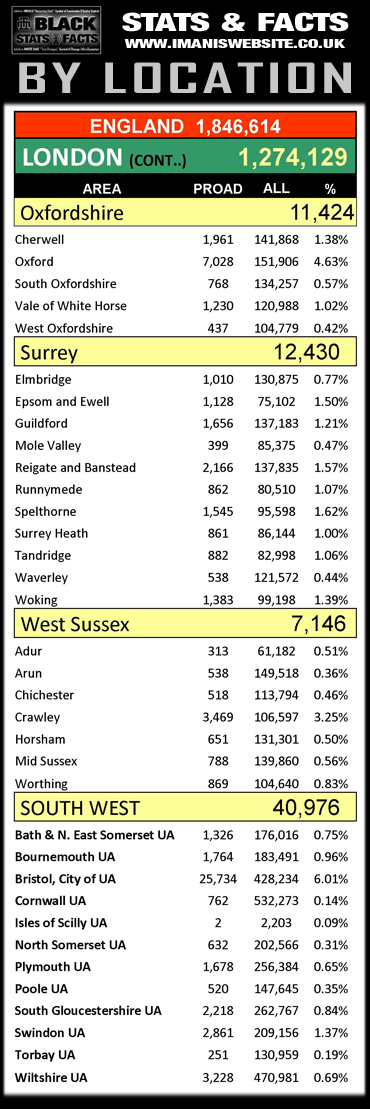 [/su_tab] [su_tab title=”LON5″]
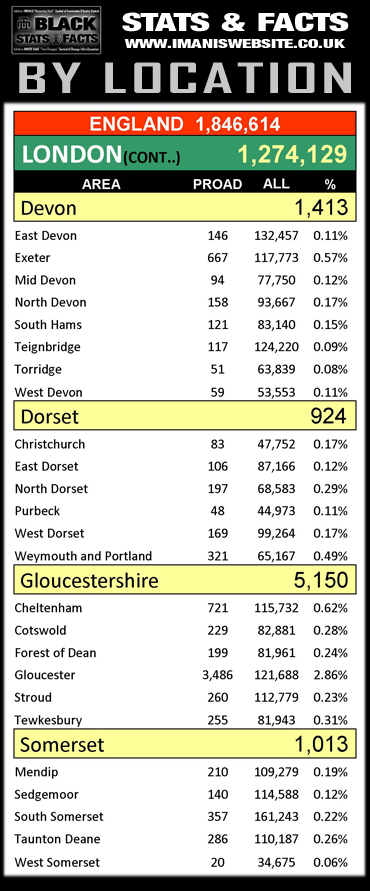 [/su_tab][su_tab title=”WALES”]
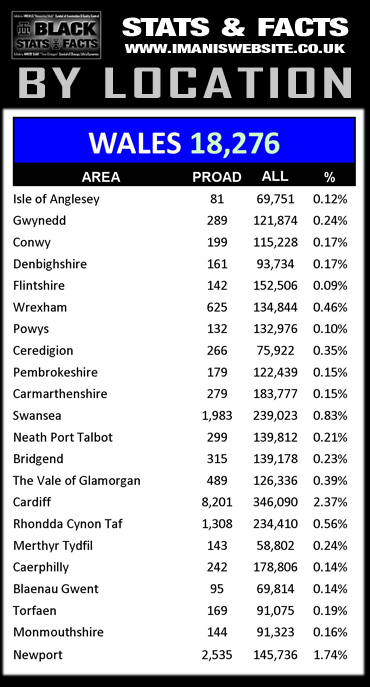 [/su_tab] [su_tab title=”SCOTLAND”]
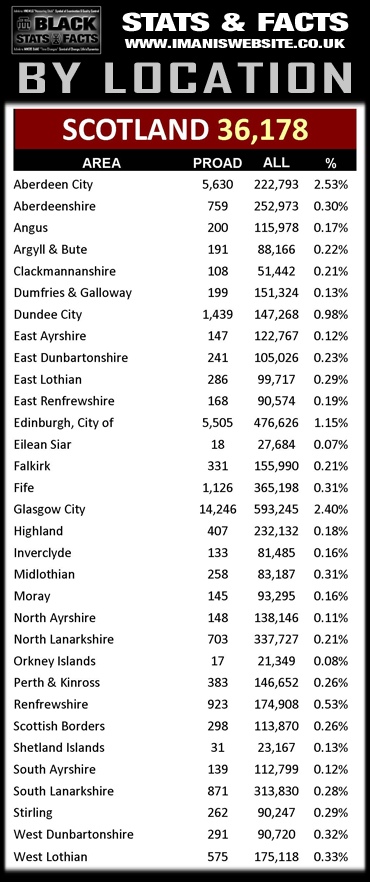 [/su_tab] [su_tab title=”NORTHERN IRELAND”]
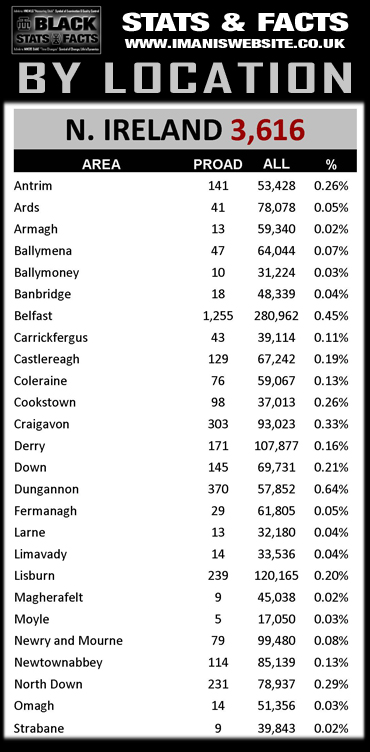 [/su_tab][/su_tabs][/su_spoiler]
Adinkra Symbol:

Name: Hwe Nu Dua
Symbolising: Measuring-stick
Representing: Examination & Quality Control
Permanent link to this article: https://imaniswebsite.co.uk/the-black-stats-facts/


 [su_tabs][su_tabs vertical=”yes”][su_tab title=”WHAT”]What is/are the Black Stats & Facts?:
 KEY POINT: P.R.O.A.D. Make p 4.4% to 4.5% of the U.K population of 56,075,912, this represents a number of approximately 2,457, 579, P.R.O.A.D. based upon the latest national statistics i.e. 2011 Census. Incorporated within this 4.5% is the African, African-Caribbean, Black, Mixed population within Britain. The largest community of the P.R.O.A.D in Britain are the African’s, direct from the continent, who makeup 1.8% of this 4.5% total P.R.O.A.D population.[/su_tab][su_tab title=”MALES”]
 KEY POINT: There are less males than females within the larger ethnic groups. What could be the reason for this? [/su_tab][su_tab title=”FEMALES”]
 KEY POINT: Females outnumber the males in all groups except the Black British. What could be the reason for this? [/su_tab][su_tab title=”0-15″]
 KEY POINT: The 0-15 year old’s make up the largest proportion of all P.R.O.A.D in Britain. All groups except the Caribbean have much higher proportions of this age range than the Whites. Caribbeans have a very similar proportion to the general populace. What could be the reasons for this? [/su_tab] [su_tab title=”16-24″]
 KEY POINT: Although all P.R.O.A.D have a higher proportion of 16-24 year old’s than the general populace, Mixed White & Caribbean nearly double that of Whites and is also much higher proportionally than all other P.R.O.A.D groups. What could be the reason for this? [/su_tab] [su_tab title=”25-34″]
 KEY POINT: Africans from the continent have a higher proportion of 25-34 year old’s than all other P.R.O.A.D and the general populace. What could be the reason for this? [/su_tab] [su_tab title=”35-49″]
 KEY POINT: 35 – 49 year old’s represent the largest proportion of the general population and the second largest proportion of aged people within all P.R.O.A.D, except the Mixed. What could be the reason for this? [/su_tab] [su_tab title=”50-64″]
 KEY POINT: Only the Caribbean groups have a proportion of 50-64 year old’s comparable to the general populace, all other P.R.O.A.D have a very small proportion of this age range. What could be the reason for this? [/su_tab] [su_tab title=”65+”]
 KEY POINT: Other than the Caribbean’s all other P.R.O.A.D have a very small proportion of people aged 65 and over. What could be the reason for this?[/su_tab] [/su_tabs][/su_spoiler][su_spoiler title=”U.K. QUALIFICATIONS BLACK STATS” style=”fancy” icon=”plus-square-1″][su_tabs vertical=”no”][su_tab title=”ALL”]
 KEY POINT: Of all the P.R.O.A.D only the Caribbean have a proportion of people aged 16+ with qualifications, comparable with that of the general populace. Other P.R.O.A.D have a much lower proportion of people with qualifications than the general populace, particularly the Mixed groups. What could be the reason for this?[/su_tab][su_tab title=”NO”]
 KEY POINT: Both the African’s from the continent and people Mixed with these African’s have less people proportionally with no qualifications than the general populace and other P.R.O.A.D. What could be the reason for this?[/su_tab][su_tab title=”L1″]
 KEY POINT: Mixed White & Caribbean have a much higher proportion of people with level 1 qualifications from the general populace and other P.R.O.A.D. Although all Caribbean P.R.O.A.D, have a higher proportion than all other groups. What could be the reason for this?[/su_tab][su_tab title=”L2″]
 KEY POINT: As with Level 1 qualifications, people Mixed White & Caribbean have a much higher proportion of people with Level 2 Qualifications also. What could be the reason for this? [/su_tab][su_tab title=”A”]
 KEY POINT: All P.R.O.A.D have fewer people proportionally who have/are doing apprenticeships, however the Caribbean & Mixed Caribbean have more people than other P.R.O.A.D. What could be the reason for this?[/su_tab][su_tab title=”L3″]
 KEY POINT: At Level 3 the African, Caribbean & Black British have similar proportions of people qualified to the general populace, however the Mixed P.R.O.A.D, have a higher proportion. What could be the reason for this? [/su_tab][su_tab title=”L4″]
 KEY POINT: Africans from the continent have a higher proportion of people qualified at Level 4 than the rest of P.R.O.A.D. including the general populace. However Mixed White & Caribbean have the least proportion of people qualified at this Level. What could be the reason for this? [/su_tab][su_tab title=”OT”]
 KEY POINT: Although this data does not indicate what other means, based upon previous heads, it is assumed that it represents higher qualifications than Level 4. This being the case both African’s from the continent & Whites mixed with these African’s have a much higher proportion of people qualified at this Level. Mixed Caribbean also have a very low proportion. What could be the reason for this? [/su_tab][/su_tabs][/su_spoiler]
 KEY POINT: Christians by far, make up the largest proportion of the general populace and all P.R.O.A.D in Britain. However natives to Africa & the Caribbean have a much higher proportion than the general populace and other P.R.O.A.D, in fact those classified as Black British and the Mixed groups, have a lower proportion of Christians than all the other featured groups. What could be the reason for this? [/su_tab][su_tab title=”MUSLIM”]
 KEY POINT: Although Muslims make up a very small proportion of general populace, both African’s from the continent and Black British have significantly higher proportion of adherents. Caribbean people and people Mixed with Caribbeans have a very low proportion. What could be the reason for this? [/su_tab][su_tab title=”JEWISH”]
 KEY POINT: There is a very low proportion of Jewish people in the general populace and amongst the P.R.O.A.D groups. Although the Jewish people make up 0.47% of the general populace. Jewish White people account for the vast majority of this number. What could be the reason for this?[/su_tab][su_tab title=”BUDDHIST”]
 KEY POINT: All P.R.O.A.D have a slightly higher proportion of Buddhist adherents than Whites, except for the Africans from the continent. What could be the reason for this?[/su_tab][su_tab title=”HINDU”]
 KEY POINT: Whites have the smallest proportion of Hindu adherents of all groups featured, whilst the Black British has the highest. What could be the reason for this? [/su_tab][su_tab title=”SIKH”]
 KEY POINT: Like with Hinduism, Whites have a very low proportion of Sikh adherents of all groups featured and again the Black Brritish has the highest. What could be the reason for this?[/su_tab][su_tab title=”OTHER”]
 KEY POINT: All groups have a very small proportion of people that stated they belong to a different religion other than those sited within the census. Of these groups African’s from the continent have the lowest proportion, whilst the Caribbeans has the highest. What ould be the reason for this?[/su_tab][su_tab title=”NO”]
 KEY POINT: Of all the groups featured the African from the continent have the least proportion by far of people with no religion, whilst the Mixed Caribbean has the highest. What could be the reason for this?[/su_tab][su_tab title=”NOT STATED”]
 KEY POINT: African’s from the continent were the least likeliest to not state what their religion or faith was. Both the Caribbean’s & Black British have the highest proportion. What could be the reason for this?[/su_tab][/su_tabs][/su_spoiler]
 [/su_tab] [su_tab title=”ARRESTS”]
 Content 2[/su_tab] [su_tab title=”PND’S”]
 Content 3[/su_tab] [su_tab title=”CAUTION”]
 Content 4[/su_tab][su_tab title=”COURT”]
 Content 7[/su_tab][su_tab title=”CONVICTION”]
 Content 6[/su_tab] [su_tab title=”JAILED”]
 Content 7[/su_tab] [su_tab title=”PRISONERS”]
 Content 5[/su_tab][/su_tabs][/su_spoiler]
 [/su_tab] [su_tab title=”N.E”]
 [/su_tab] [su_tab title=”N.W”]
 [/su_tab] [su_tab title=”YRK”]
 [/su_tab][su_tab title=”E. MIDS”]
 [/su_tab][su_tab title=”W.MIDS”]
 [/su_tab] [su_tab title=”E”]
 [/su_tab] [su_tab title=”LONDON”]
 [/su_tab][su_tab title=”LON2″]
 [/su_tab] [su_tab title=”LON3″]
 [/su_tab] [su_tab title=”LON4″]
 [/su_tab] [su_tab title=”LON5″]
 [/su_tab][su_tab title=”WALES”]
 [/su_tab] [su_tab title=”SCOTLAND”]
 [/su_tab] [su_tab title=”NORTHERN IRELAND”]
 [/su_tab][/su_tabs][/su_spoiler]